A picture is a poem without words.
By Horace
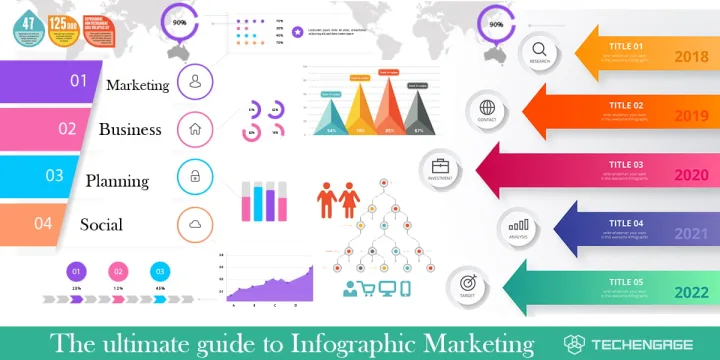
At the heart of content marketing, there has been an increased amount of businesses and people using visual content, and that content relies on infographics. As a result, infographics, amongst other content marketing, are becoming the most popular visual content trend as people read and view infographics, whether on social media platforms, web pages, stock images, videos, quotes, advertisements, and many more.
The term’ infographic‘ is divided into two words: information and graphics, which means presenting information, data, or knowledge visually.
Table of Contents
The Purpose of Infographics
Infographics are created or designed for many purposes, from website traffic to sharing posts between friends and families. In addition, infographics are a part of visual communication as the information is viewed easily without explaining the image’s representation through words.
Charts and graphs are also an essential part of infographics as they explain the trend of the data to pass the message to the audience. However, not all charts and graphs are interpreted easily, as some visuals are only targeted for a particular purpose. For example, in the education sector, pie charts can identify why a parent wants their child to be admitted to that specific school, the reasons being reasonable fee structure, the standard of delivering the education, or excellent facilities. Scatter graphs are used to interpret the data that links the relationship between the number of people smoking and the number of people getting lung cancer.
Charts and graphs speak for both presentation and exploration as they visualize the story behind what the data indicates. Likewise, infographics can be used to present and explore what the data or information is being conveyed to the audience. This is the primary purpose of using infographics in firms. Here are some specific examples of infographics being used for business purposes.
Business Growth Visualizations: Using an infographic to show the growth of a business over time allows potential customers and partners to understand the trajectory of the business.
Market Segmentation Analysis: Infographics can be used to show how different customer segments are engaged with a business’s products and services.
Product Comparison Charts: Infographics can help to illustrate the features and benefits of a product or service in comparison to its competitors.
Social Media Performance Reports: Infographics can be used to provide an overview of how a business’s social media accounts are performing.
Employee Performance Dashboards: Infographics can be used to track and visualize employee performance metrics.
Network and System Diagrams: Infographics can be used to visualize complex network and system architectures.
Creating Effective Infographics
Infographics are a great way to quickly communicate complex information in an easy-to-understand format. However, to create effective infographics it is important to understand the principles of graphic design and use the right colors, fonts, and images to convey the message clearly.
Color: Color is one of the most important elements of an infographic. It can be used to draw attention, emphasize certain elements, and create a consistent visual theme. Choose colors that are appropriate for the topic and will help communicate the desired message.
Font: Font is also an important element of an infographic. Choose a font that is easy to read and will not distract from the message. Avoid using too many different fonts as this can be distracting.
Images: Images are an important part of an infographic. Choose images that are relevant to the topic and will help illustrate the point you are trying to make. Avoid using too many images as this can be distracting.
These tips will help ensure that your infographic is effective and communicates the desired message. Remember to keep it simple, focus on one topic, and use the right elements to draw attention and convey the desired message.
Examples of Infographics
Here we incorporate more examples of infographics, for instance, using real-life scenarios where infographics can be useful to help our readers better understand the benefits and drawbacks of using infographics.
Example 1: A small business owner needs to quickly explain the benefits of their product to potential customers. An infographic can help them quickly show the features of their product and how it compares to similar products on the market.
Example 2: An online educator wants to create an engaging and interactive way to explain a complex process. An infographic can help them break down the process into easy-to-understand steps and visuals.
Example 3: A research team needs to present data in a more interesting way. An infographic can help them present the data in a visually appealing way that is easier to understand and digest.
Advantages of Infographics
Infographics have several advantages, which are mentioned below:
- Easy to understand – infographics are easy to understand as the information is interpreted easily.
- Minimal words – the paragraphs are translated into graphical content with limited phrases that can be easier to explain.
- Eye-catching – infographics tend to be very eye-catching, which appeals to the viewers or readers.
- Easy to share – infographics can be shared easily without acknowledging who created the design or worrying about copyright issues.
Disadvantages of Infographics
Infographics do have certain pitfalls, which are mentioned as follows:
- Time-consuming – infographics are not done without research as the design and layout must be planned carefully to avoid misleading information.
- Not quite enough – they don’t always give you the full story as they lack lengthy words and paragraphs, and there isn’t enough room for the words to be put into.
- Hard to read – infographics can be hard to read if the space of the information is crammed too much with images and phrases.
- Infographics are often difficult to read – If the information is presented in a complex manner, it can be difficult for viewers to understand the meaning behind the visuals.
- Infographics can be too simplistic and lack depth – If an infographic is too basic, it can fail to convey the complexity of a topic or the nuances of an argument.
- Infographics can be biased – If the creator of an infographic has an agenda, then it can be difficult to separate bias from fact.
- Infographics can be misleading – If the creator of an infographic doesn’t provide enough context, then viewers may be misled or misinformed.
- Infographics can be difficult to share – If the creator of an infographic doesn’t provide a digital version, then it can be difficult to share the information with others.
How to Avoid Infographics Pitfalls?
Here are some tips for creating effective infographics that avoid the pitfalls.
Choose a clear, direct message: Before you start designing, decide what message you want to communicate and make sure it’s one that is clear and direct. This will help ensure that the visual elements of your infographic don’t distract from the key message.
Keep it simple: When it comes to creating an effective infographic, less is more. Try to use the fewest number of elements possible to get your point across and avoid clutter.
Use the right visuals: Visuals are key to creating an effective infographic, so be sure to choose the right ones. For example, if you’re trying to illustrate a process, use a flowchart or timeline.
Use high-quality images: Low-quality images can be a major distraction and can take away from the overall effectiveness of your infographic. Make sure to use high-quality images that will draw viewers in.
Pay attention to color: Colors can have a big impact on how an infographic is received, so choose colors that will complement each other and create a cohesive look.
Use data and statistics: Data and statistics can help to make a point and give your infographic credibility, so be sure to include them where appropriate.?
Depending on the amount of information and the size of the images used, infographics definitely have benefits and pitfalls that need to be considered before creating one. Whether you are sharing posts or designing infographics for business purposes, infographics are used to interpret results and display a story. A story that can be revealed behind the data allows the audience to explore the content behind it.
According to BuzzSumo shows, studies have shown that articles of 75 – 100 words with an image got twice the number of shares compared to those without the images.
To conclude, infographics have played an important role in visual content marketing. Visual content is not something new; it has been used for quite a long time. Infographics are not always a hundred percent reliable.
However, infographics should be used in the right context and target the right audience to boost engagement on the web page and any social media platform. Infographics have to be included, as without any form of visual content, it would have been dull and boring for the audience. The creativity of infographics never ends!
So indulge your site with infographics for better website traffic!


